Run the TE pipeline
For this tutorial, we use the hiPSC-CM-chr1-example with the hiPSC-CM-test.yaml configuration file.
How to run the pipeline
To run the pipeline, change the paths in the configuration file to point to the location where you extracted the data, e.g. /home/user/data/hiPSC-CM-chr1-example. You can do this using a text editor, or simply by modifying the file in place
sed -i 's|/path/to/your/hiPSC-CM-example|'`pwd`'|g' hiPSC-CM-test.yaml
Important
Default parameters were modified for the example and included in the configuration file. If you use this configuration file as a general template for your data, do not forget to remove everything below the line “REMOVE BELOW THIS LINE IF YOU USE THIS CONFIGURATION FILE AS TEMPLATE FOR YOUR DATA”.
For the example, you don’t have to create the indices and annotation, they are included with the input data. Finally, run the abundance estimation pipeline from the hiPSC-CM-chr1-example directory (or adjust the paths accordingly)
run-htseq-workflow \
 ribo \
 hiPSC-CM-test.yaml \
 --run-all \
 --trim-rna-to-max-fragment-size \
 --ribo-config hiPSC-CM-test.yaml \
 --star-options "--quantMode GeneCounts" \
 --htseq-options "--idattr orf_id" "--additional-attr orf_type" "--additional-attr gene_name" "--stranded yes" \
 --rna-stranded reverse \
 --gtf input/ribo-ORFs.chr1.gtf \
 --rna-config hiPSC-CM-test.yaml \
 --num-cpus 4 \
 --keep-intermediate-files \
 --logging-level INFO \
 --log-file ribotools-pipeline.log
If you have access to a cluster with a cluster management and job scheduling system such as Slurm, you can --use-slurm and pass additional options.
The file ribotools-pipeline.log contains logging output for the different processing steps. You now have two new directories riboseq-results and rnaseq-results, each with five sub-directories: a directory called without-adapters (Flexbar output), directories called with-rrna and without-rrna (Bowtie2 output), a directory called without-rrna-mapping (STAR output), and a directory called count-tables (final output from HTSeq). Under riboseq-results, there is one additional directory called metagene-profiles containing model outputs for periodicity estimation, periodic lengths and offsets.
How to estimate TE
Prepare the sample table
get-sample-table hiPSC-CM-test.yaml
You should have a new directory, called tea-results, containing the file sample-table.csv. Finally, fit the data with
run-tea --orfCol 2 --symbolCol 3 --lfcThreshold 0 --alpha .99 hiPSC-CM-test.yaml
Under tea-results, there is now a new sub-directory containing the output of the LRT model for the contrast d5_vs_d1. The different classes of regulated ORFs are show below
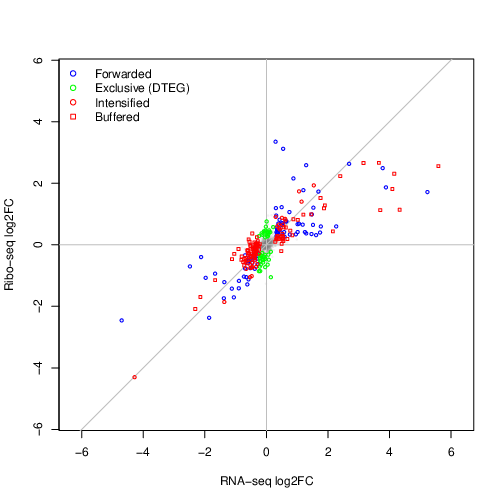
Note
The test dataset contains only a subset of the original data. Values for --lfcThreshold and --alpha are not meaningful and only
meant to produce a sufficient number of features in each class. Despite this, we are able to see features associated with relevant
cardiac maturation regulatory processes.